
Zabbix 8.0 LTS: native OpenTelemetry and an MCP server
Summary
Zabbix 8.0 LTS is a free, open-source monitoring platform that takes OTLP directly, folds traces and logs into one store and opens an MCP server for AI agents.
Recommend- Name
- Zabbix
- Version
- 8
- Pricing
- Free
- Open source
- Open source
- Operating system
- LinuxWindowsWeb
- Website
- https://www.zabbix.com/
- Updated
- 2026-11-15 12:09
Zabbix is the monitoring platform that sits in a corporate network, runs untouched for years and gets remembered when something breaks. Version 8.0 LTS, out on November 5, does more than add rows to a feature table: it brings OpenTelemetry into the native pipeline so metrics, traces and logs land in one store, and it hands AI agents an official way in. The server still installs on your own Linux machine, the browser opens the web interface, the code ships under AGPLv3, and the licence costs nothing; the bill is operations time and hardware.
OpenTelemetry no longer needs a middle layer
Pushing application traces into Zabbix used to mean building a translation step yourself, with a script or a collector, which always left one more thing to maintain. Version 8.0 accepts OTLP directly: a Zabbix proxy takes the data over OTLP/gRPC, from the application itself or from an OpenTelemetry collector that already runs, and no extra layer has to be deployed for the integration.
One trap deserves spelling out. The receiver lives only in the proxy; the server has no collector of its own and no matching switch in its configuration, so an environment that never needed a proxy now has to stand one up for APM. It can share the machine with the server, and no second box is required. The protocol is OTLP/gRPC only, default port 4317; the HTTP path on port 4318 does not work, so an exporter either speaks gRPC or goes through a collector first.
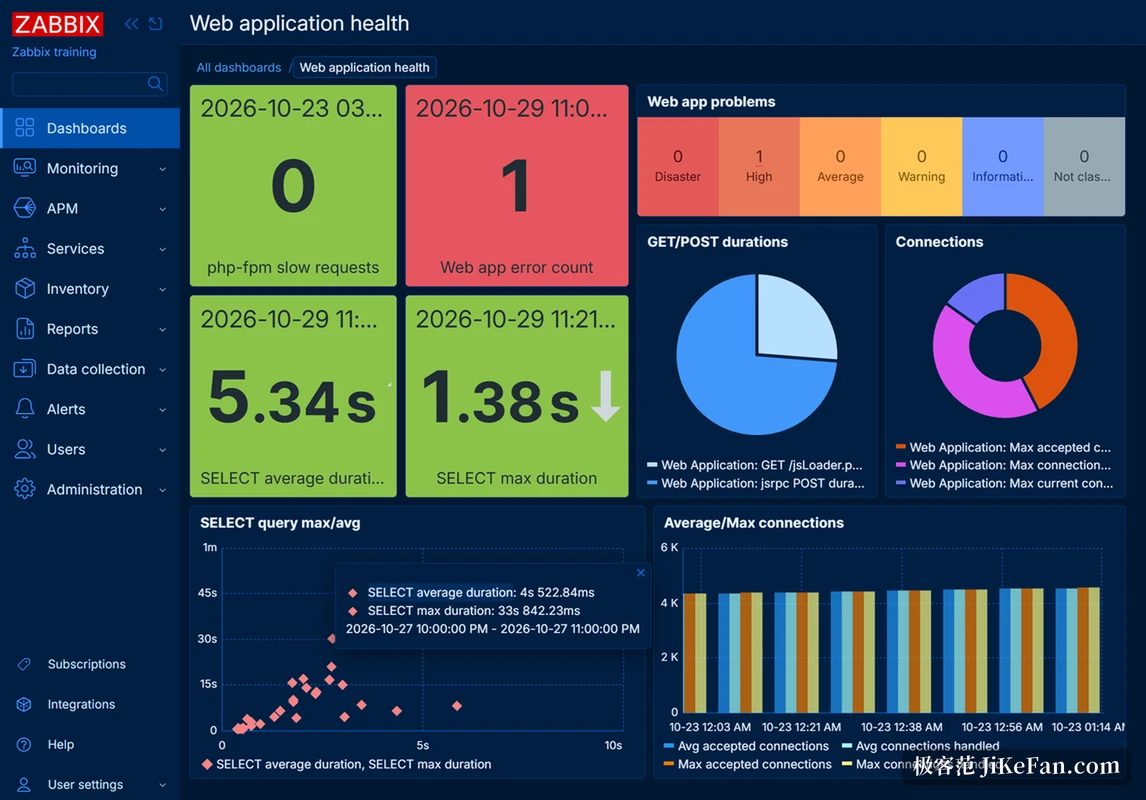
The web interface gains an APM block on the left with three views underneath, Traces, Metrics and Logs, each read on its own. The dashboards show error counts, latency distribution for GET and POST, connection numbers and slow request counts, and drill down to the maximum and average delay of a specific query. The new telemetry query data type matters here: charts and triggers both reference it, and low level discovery rules can use it, so trace data stops being something you only look at and enters alarm rules.
The release notes sum up the main line in one sentence: metrics, traces and logs in a single platform.
What a single request looks like
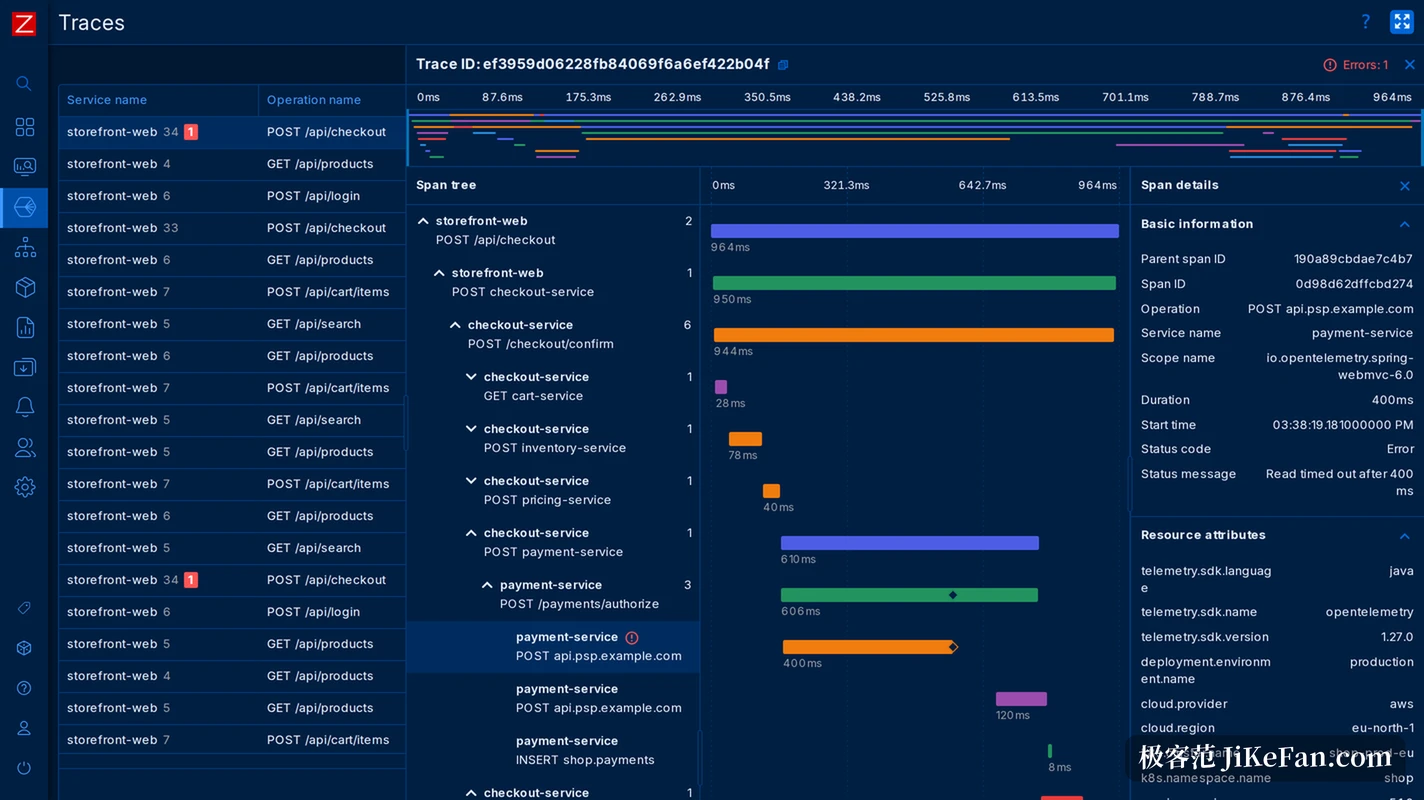
The trace detail page earns its own paragraph. A request arrives, the service and operation pairs are listed, and opening one shows the span tree, from the gateway to the order service to the payment service, with each level drawn as a block whose length marks its time and the failing section in red. The right side lists the Span ID, the parent span, the status code and the error message, plus resource attributes such as the telemetry.sdk version, the cloud vendor, the region and the Kubernetes cluster. Finding out why a timeout happened no longer means switching between three systems.
Alerts stop pouring out one by one
CEP, complex event processing, is the other centre of gravity. An administrator writes JavaScript matching logic that analyses the event stream over a configurable time window, and the engine sorts related problems into cause and symptom groups: when a database upstream dies, the string of downstream errors lands on one cause instead of filling a chat channel with dozens of alerts. Deduplication, suppression and discarding come along, plus a cap on how many events of one kind may pass, aggregation of similar events by location, and alerts fired in reverse when events arrive too often or never appear at all.
The AI part ships as an official MCP server. A compatible agent reads monitoring data, walks the problem history, acknowledges alerts, changes severity and manages maintenance periods. Permissions open no new door: the agent works through existing user roles, and what it may do depends on the API token it was given, so it cannot step outside the old boundaries.
The performance bill lands on storage
The project claims up to ten times the performance from the new storage architecture and server work, with lower CPU load, less disk I/O and less space used. In practice ClickHouse can serve as the backend for history and telemetry data, moving analytical load off the relational database; parallel loading of history shortens startup; proxy and agent switch to the c-ares resolver for DNS caching; and the backend accepts several PostgreSQL nodes.
A measurement from the launch event says more. One laptop running server, database, proxy and front end held a steady 1.4 million metrics per second without degrading. The project credits two changes, bottlenecks removed one by one inside the server and compression work for the new storage engine, and a side effect is simpler capacity planning: the bottleneck is essentially CPU and memory, so a faster machine buys more throughput.
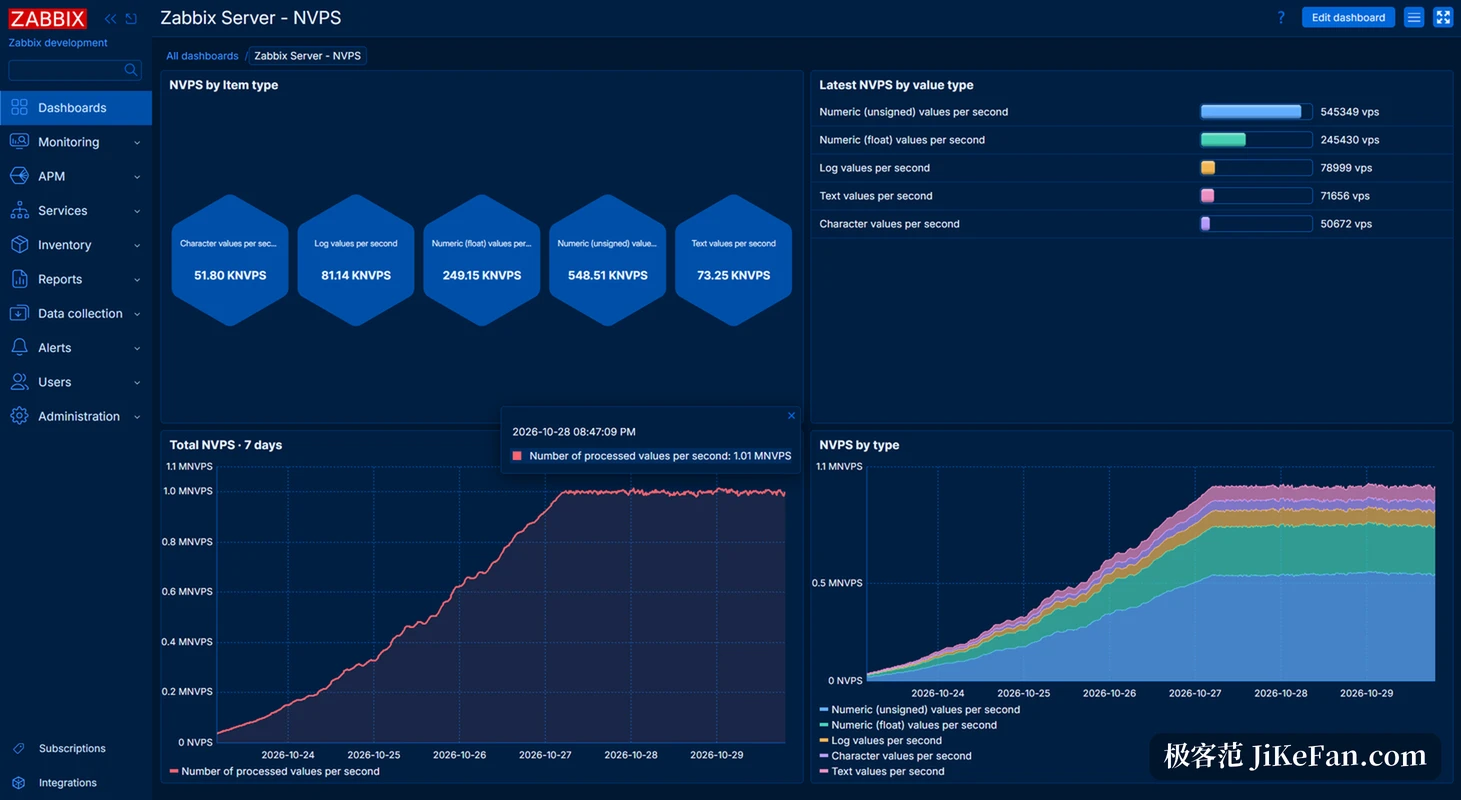
That dashboard shows the order of magnitude: across five data types, the numeric one alone passes half a million values per second. Scenarios like this used to need a separate time series database, and one system now carries them.
Smaller work on the interface and on security
Tables in the web interface hide columns, reorder and resize them and accept custom columns; a dark blue theme arrives with built-in fonts; forms validate inline, and SAML certificates and private keys import straight from the interface instead of being edited into a configuration file. Dashboards import and export as YAML, JSON or XML, a scatter plot widget is new, chart widgets gained interaction, and the geomap widget can merge nearby markers into one.
Security tightened in several places: API access for user roles is off by default and has to be enabled explicitly, HashiCorp Vault AppRole authentication is new, agent item keys accept configurable limits, and the audit log can be exported.
Two sums to do before upgrading
The template library gains Podman, Kubernetes, Proxmox VE, Microsoft Hyper-V, MariaDB and Percona, and dashboards for cloud provider resources and costs import as they are. For teams already on an older release, the support window is the practical argument: full support until November 30, 2029, limited support until November 30, 2031, five years from one upgrade. The other sum is the surface of change, since API access is off by default, the correlation logic was rewritten and storage can move to ClickHouse; none of that is a switch to flip, and a test environment is the safer first stop.
Whether it is worth it depends on where the team hurts. If alert noise is loud, trace investigation is manual puzzle work and an AI agent needs a proper entrance, the 8.0 changes aim at exactly those places. If Zabbix only watches whether a handful of servers are alive, the version already running loses nothing by staying.