
An AI assistant for equity research: Qovest and its scheduled runs plus research space
Summary
Qovest puts data fetching and writing on one chain, so every chart in the report can be checked against its source. Trading-day tasks keep the research moving, and results are archived so the next round starts from context instead of zero.
Recommend- Name
- Qovest
- Version
- 20261105
- Open source
- Proprietary
- Operating system
- Web
- Website
- https://www.qovest.cn
- Updated
- 2026-11-05 23:00
Qovest goes after the most expensive stretch of research work: gathering the data, reading the material through, and turning the conclusion into a report somebody else can read.
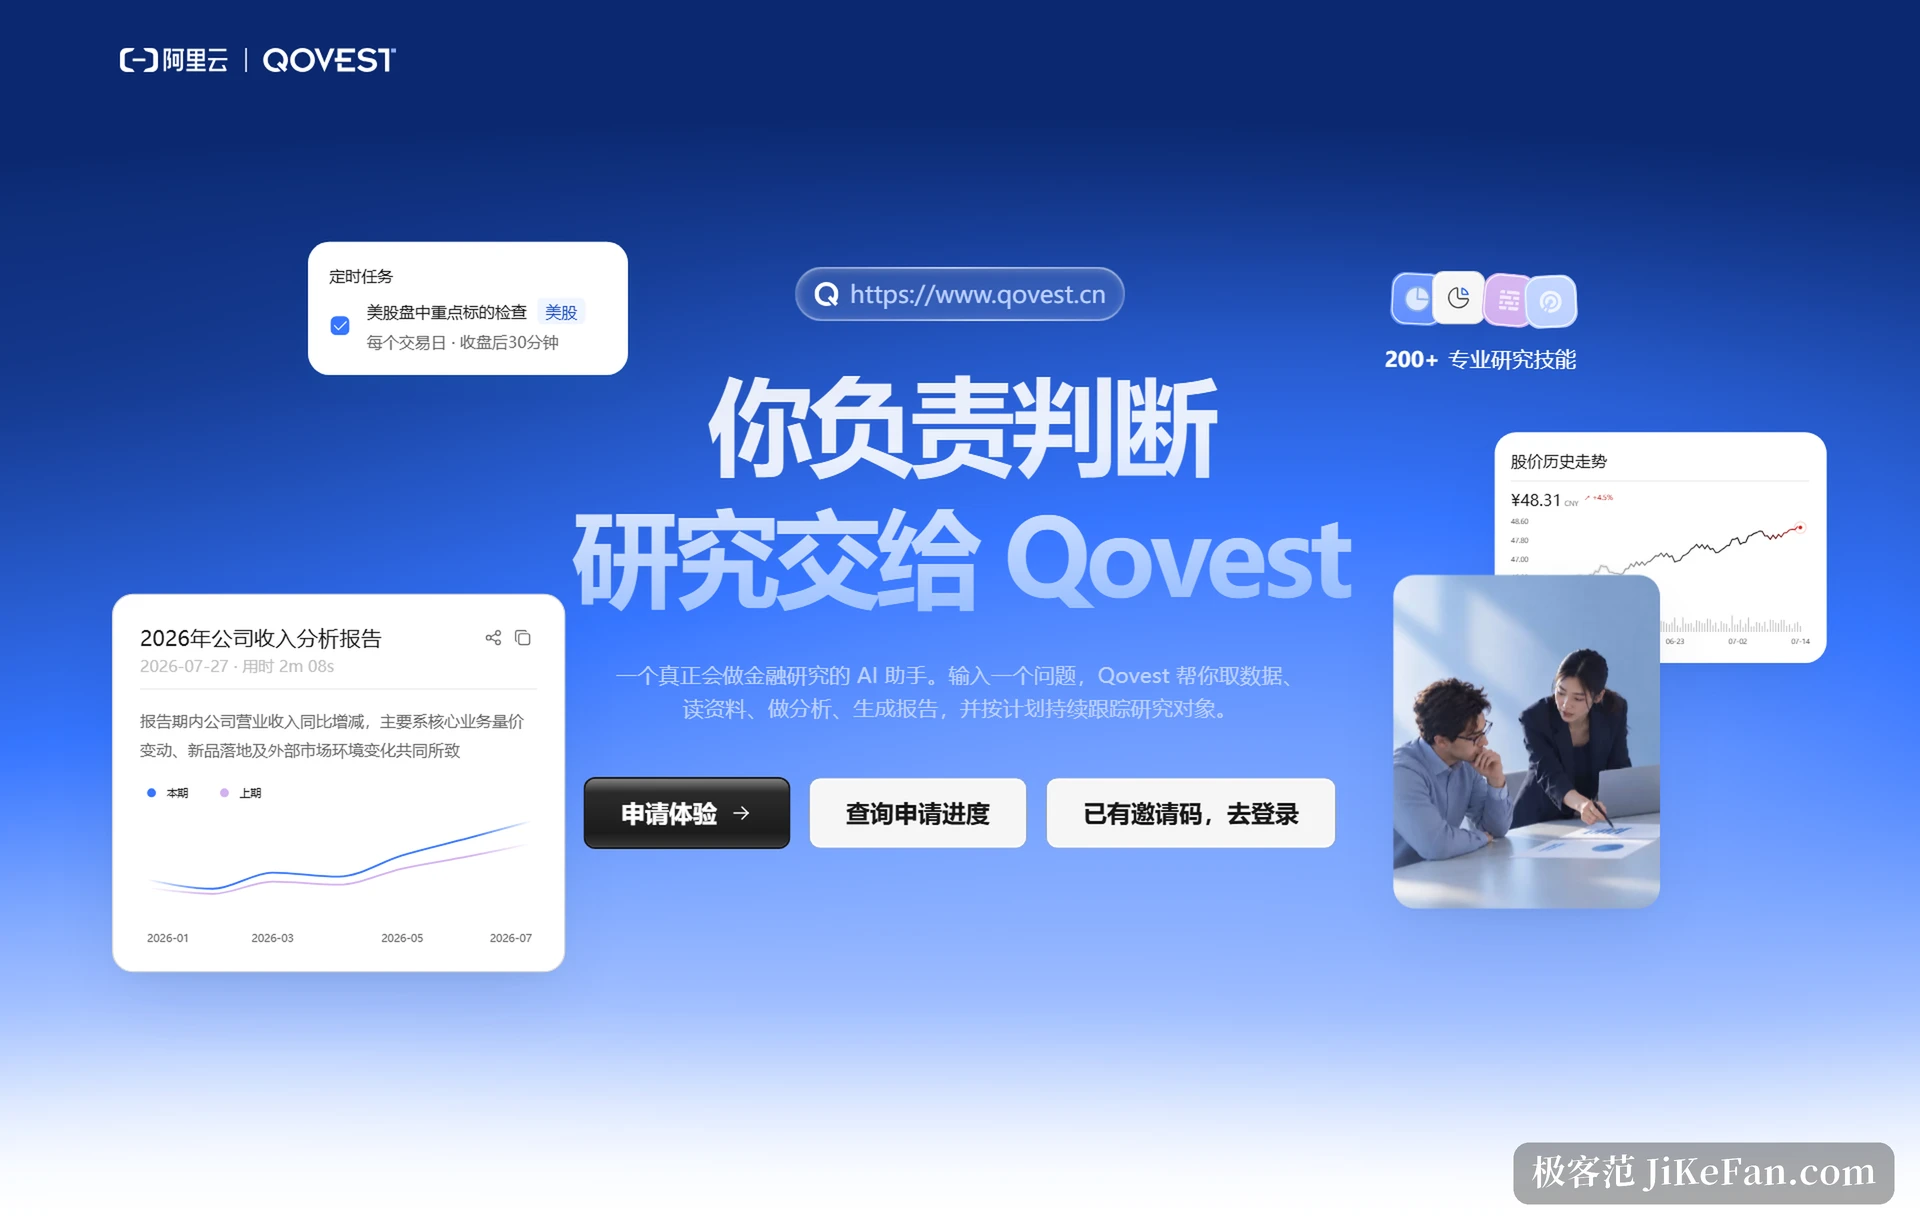
One sentence in, tasks split before data is fetched
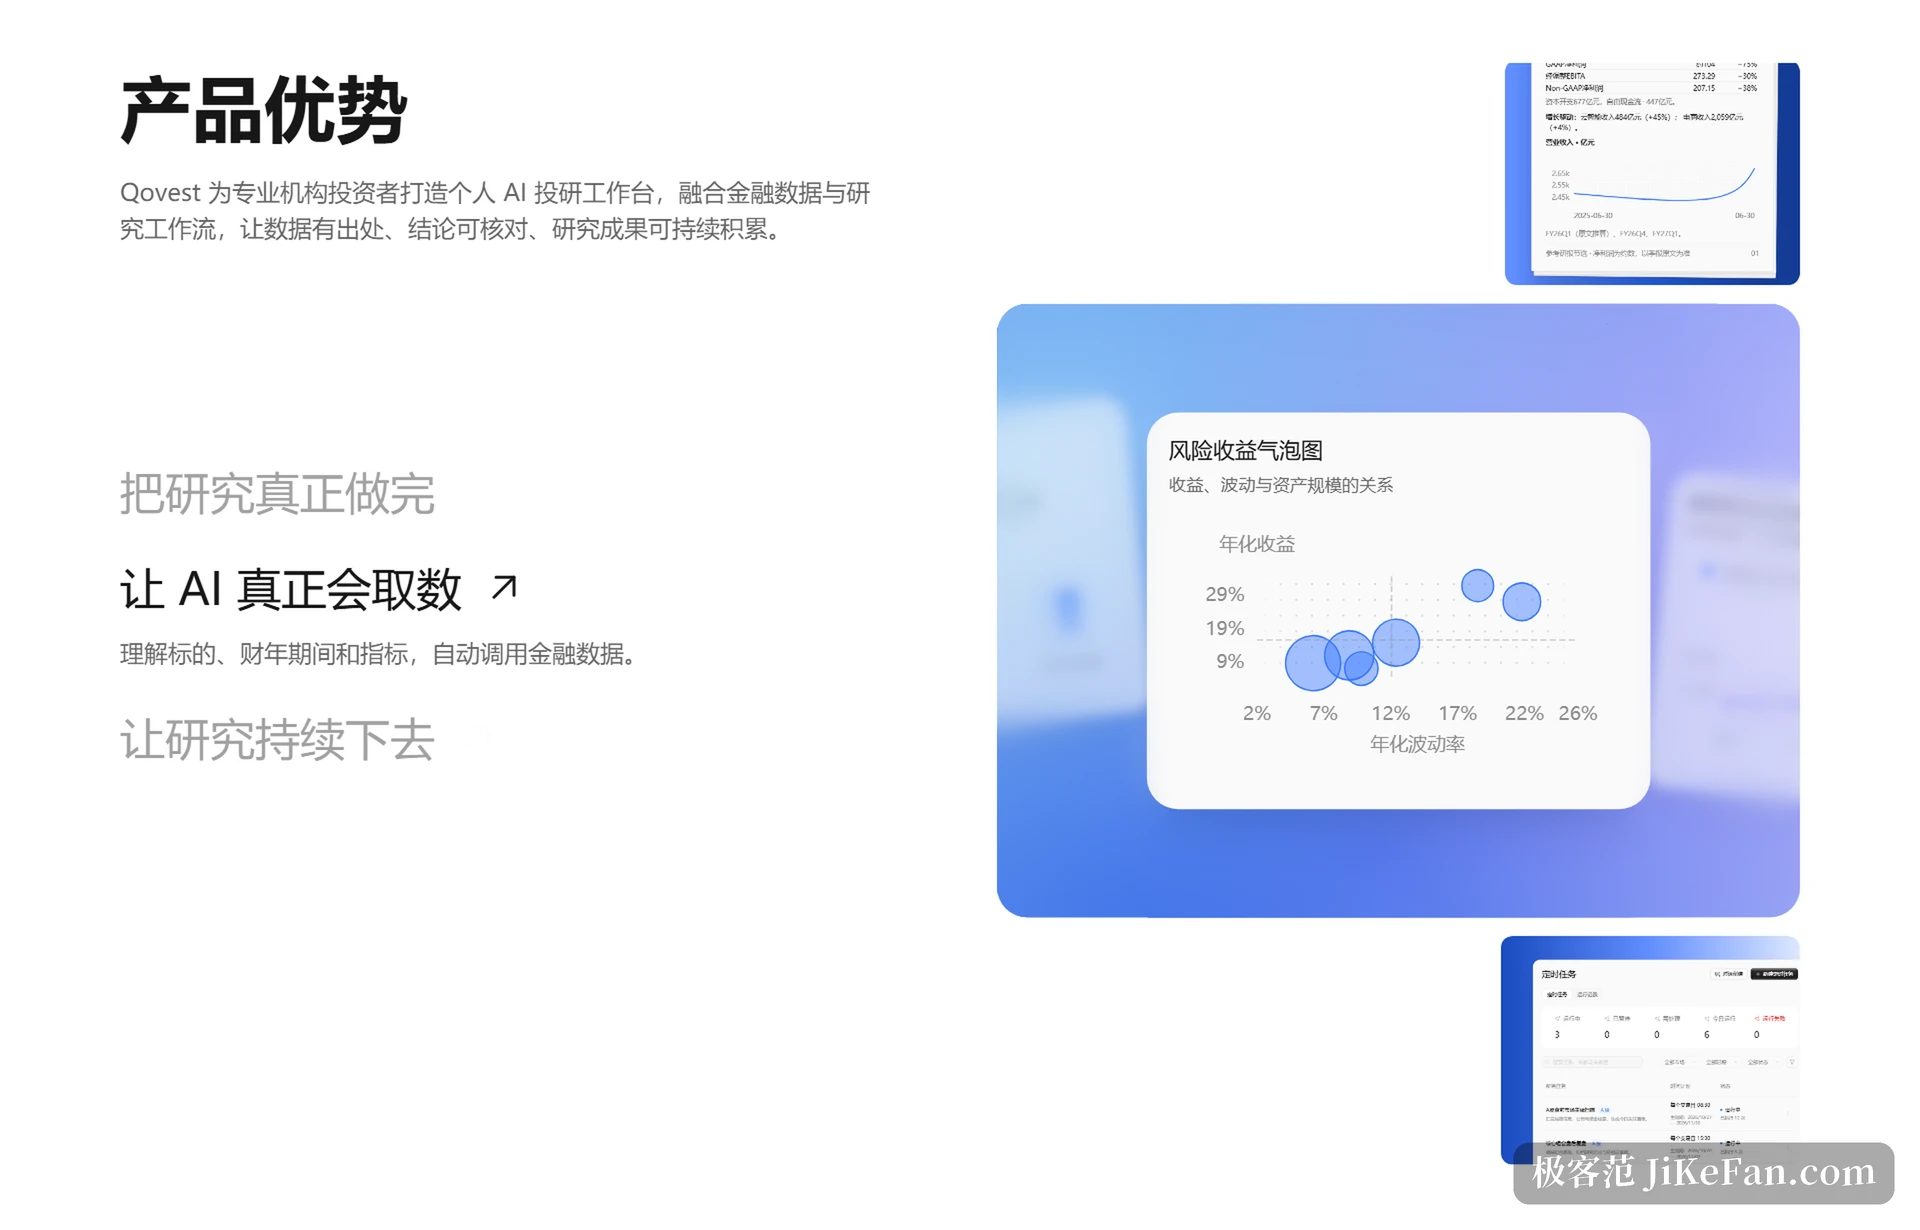
Qovest is an AI research workstation from Alibaba Cloud, released on 11/2, with the Chinese name Wanrui Yanjian. The official page breaks the pitch into three lines: finish the research properly, make the AI actually fetch data, and keep the research going. The first is orchestration, where you state what to research and it grasps the goal, splits the steps, calls the tools and produces a report. The second is data, where it has to understand the security, the fiscal period and the definition of the metric before pulling the matching financial data by itself.
Neither is remarkable alone, and together they are the point. A general chat tool can also produce something that looks like a research note, but where the numbers came from and whether the definitions line up is usually left unsaid. Qovest puts fetching and writing on one chain, and the charts on the page, from the risk-return bubble to profit attribution, revenue mix shifts and the government bond yield curve, are generated straight from the data it fetched, so they can be checked against the source.
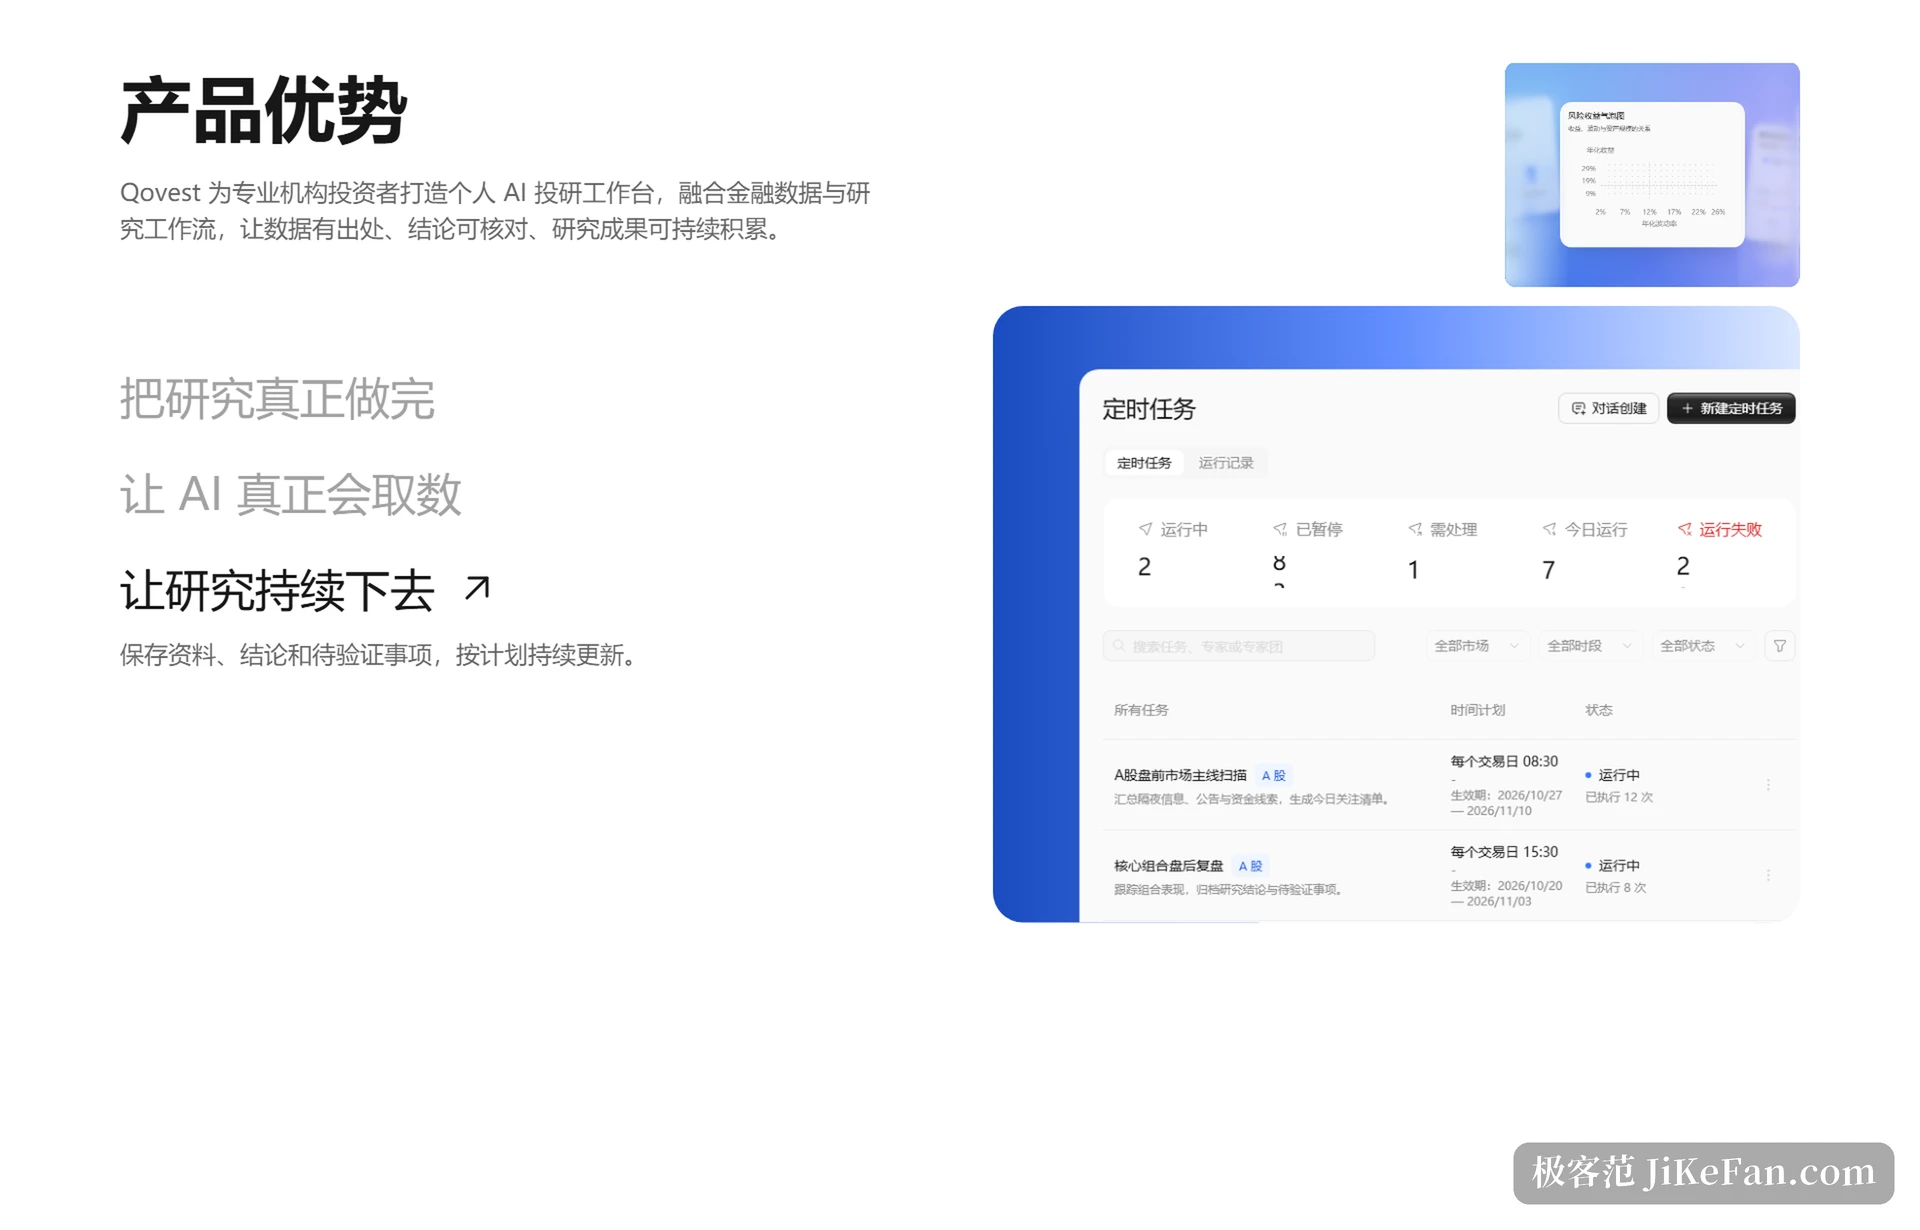
Scheduled tasks that keep research moving with the market
This is the more practical part. A task can be set per trading day or per week. In the examples on the site, an A-share pre-market scan of the main threads runs at 8:30 every trading day, pulling overnight information, filings and fund flow clues into a list for the day; a post-close review of the core portfolio runs at 15:30 each trading day; and a weekly AI supply chain tracker refreshes filings, industry data and research material every Friday evening. Each task carries its effective period and how many times it has run, and the outcome is visible in the list.
This work used to be manual: overnight overseas markets, filings, flows, then a pack for the morning meeting. Handed to a scheduled task, the person is left judging which items on that list actually matter instead of assembling the material from zero.
Research space, so work does not restart from zero
The third claim rests on continuity. Every round of results, material, conclusions and open questions is archived into the research space, so the next session does not need the background explained again. The official line is that data has provenance, conclusions can be checked and findings accumulate; in operation it means one company becomes a thread you can return to and test against the assumptions made at the time.
Two analysis features come alongside: an interactive supply chain map that breaks down the per-link value and the level of domestic sourcing, and assumption-linked modelling that recalculates once the premises change. Traditional financial terminals have these too; the difference here is that the entrance is natural language, with no query syntax to learn first.
Where the data comes from
What decides whether a research tool is usable is not the interface but the data. The disclosed position is that authoritative financial databases are licensed and deployed on Alibaba Cloud, alongside an in-house agent framework for financial work that connects the call for data to the analytical output. The team also mentions comparisons on open financial benchmarks, though that kind of testing is the vendor testing itself and should be discounted; the real check is running a question you already know the answer to.
Timeliness is the other practical question. Quotes are loaded into the database in batch after the close, which leaves a gap, so anyone whose research needs an intraday real-time view should know that in advance.
How to get access now
The product runs on applications. The site gives three steps: submit a trial request, get matched to a testing batch by research need, and start using it once opened. Individuals can apply as well, receiving a set of credits after registering and then paying monthly; an enterprise edition aimed at teams in brokerages, funds and asset management is said to be coming soon.
One thing should be clear: this is a research tool, its output is research reports and data charts, and none of it constitutes investment advice. What it saves is the time spent finding material, computing metrics and assembling the layout; the judgement stays with the person using it.
The value of Qovest is not that it can write a research note, but that it strings fetching, analysis and archiving into a flow that can be run again and again. For someone processing a large volume of material every day, what comes back is the time spent assembling it; whether the conclusion holds is still your call.