
k6 2.3.0 puts load testing in the pipeline, with JavaScript scripts and thresholds that decide pass or fail
Summary
k6 runs on a Go engine and its scripts are written in JavaScript or TypeScript. A threshold that is missed fails the run, results can land in Grafana, and the current release is 2.3.0.
- Name
- k6
- Version
- 2.3
- Pricing
- Free
- Open source
- Open source
- Operating system
- WindowsLinuxmacOS
- Website
- https://grafana.com/oss/k6/
- Updated
- 2026-10-21 12:40
k6 is an open source load testing tool: the engine is Go and the test scripts are JavaScript or TypeScript. It treats performance testing as part of software engineering, so scripts live in the repository, thresholds are written into the script, the run ends with a verdict, and the whole thing hooks into a pipeline.
One binary, one script
Distribution matches any command-line tool: deb, rpm and tar packages for Linux, x64 and arm64 archives for macOS, msi and zip for Windows, and a single binary runs once it is on the path. The project is maintained by Grafana Labs, started in 2016, joined Grafana Labs with the startup in 2021, and is licensed under GNU AGPL version three.
A script is a JavaScript module, and the exported default function is one round each virtual user runs; settings live in an options object and can be overridden from the command line. TypeScript works as well. The engine is Go, and one process can raise a large number of virtual users on very little memory, which is the point it keeps making.
Thresholds: writing the SLO down as a criterion
Thresholds are the line between this tool and running something once to see. They put a passing mark on a metric, and a run that misses it returns a failing state. The examples in the documentation are concrete.
Criterion | Threshold example |
|---|---|
Error rate | Below one percent |
95th percentile response time | Below 200 ms |
99th percentile response time | Below 400 ms |
One particular endpoint | Always within 300 ms |
Custom metrics take thresholds the same way. Because the exit code changes with the result, a threshold becomes a switch inside a pipeline. The official three steps toward automation are: write thresholds for the test, automate the execution, then attach alerts to failures, and after that a person is needed only when the system misses its mark.
Checks: assertions that do not abort
A check verifies a boolean condition, whether a status code is 201 or a response body is the right size. It looks like an assertion in most test frameworks, with one key difference: a failing check does not abort the test and does not fail the run, it only records the failure rate as a metric.
For a check to actually block a release it has to be paired with a threshold: the check records facts, the threshold draws the conclusion. That division lets one load run collect every odd sample and still end with a clear yes or no.
Scenarios: several traffic shapes in one test
A scenario describes how virtual users and iterations are scheduled. One script can declare several scenarios, each running a different function with a different executor, independent and parallel; staggering their start times produces an order. Each scenario can carry its own environment variables and tags, and results split by tag when summarised.
That mechanism maps onto the shape of real traffic: steady fixed concurrency, a ramp that adds pressure step by step, pressure by arrival rate rather than by user count, and spikes and soaks. A load script therefore need not be rewritten for each shape.
Protocols and extensions
Four protocols ship in the box: HTTP/1.1, HTTP/2, WebSocket and gRPC. HTTP/2 upgrades automatically, connecting over HTTP/1.1 first and switching when the server says it can, with no change to the script.
Testing anything else means building a binary of your own. The project offers a build tool called xk6, and the community has used it to reach SQL, Kafka, ZeroMQ and Redis. Extensions fall into four kinds: JavaScript extensions add an interface to scripts, output extensions send metrics to a custom format or service, secret extensions supply credentials to a test, and subcommand extensions add custom commands under the k6 namespace.
Where the results go
By default a closing summary prints aggregated statistics. For every data point there is a real-time streaming output, written to a JSON file or pushed straight to a backend. The destinations the site lists include Prometheus, Mimir, Datadog, New Relic and Timescale, and the built-in web dashboard draws the curves live.
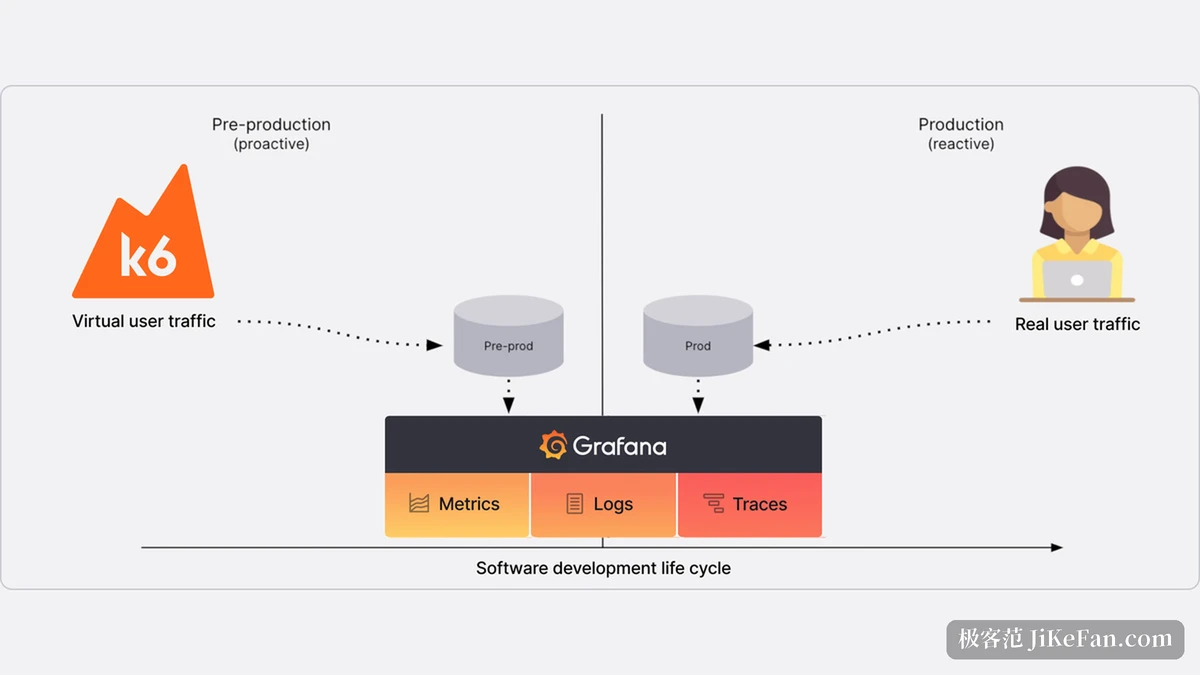
The chain sits close to what Grafana is for: k6 manufactures synthetic traffic, Grafana collects metrics, logs and traces, and together they form one timeline of pushing before a release and watching real traffic after it.
What 2.x changed
2.0 was a cleanup: long-deprecated commands and flags came out, the Go module path moved to a new address carrying v2, and every extension had to follow with its import path. It is a breaking upgrade, and the release notes say so plainly.
2.3.0, dated 21 September 2026, adds practical things: a scenario flag to run only some of the scenarios in a test without editing the script, a once flag that lets a load script serve as a smoke test and a functional test, and experimental support for async groups so metrics stay in the right group after an await. A separate 1.8.2 on 12 October only fixes security problems in dependencies and adds no features: two release lines run in parallel, one moving forward and one taking patches only.
Who should use it
Teams already on the Grafana observability stack meet almost no friction: metrics land in the same store and dashboards can be shared. Developers used to keeping tests in the repository find it handier than graphical load tools, since a script can be reviewed, reproduced and put in a pipeline.
Conversely, to squeeze an endpoint once and read a number, a command line plus a few dozen lines of script is still the shortest path; there is no visual composer and none is planned. The assumption is that performance testing, like unit testing, belongs to the people who write the code.
k6 pulls performance testing toward code: the script is code, the criterion is a threshold in that code, and the verdict is an exit code. A Go engine raises traffic on as few resources as it can, and the Grafana backend turns traffic into curves worth reading. Started in 2016, folded into Grafana Labs in 2021, over thirty-one thousand stars, AGPL version three, and a road of testing performance the way unit tests are run.