
Connected Papers maps a field instead of handing you a list
Summary
Give Connected Papers a DOI, an arXiv link or a paper title and it screens roughly 50000 papers to draw a graph of the several dozen closest ones, laid out by similarity rather than by citation. The free tier builds 5 graphs a month with every feature included.
Recommend- Name
- Connected Papers
- Version
- 20260917
- Open source
- Proprietary
- Operating system
- Web
- Website
- https://www.connectedpapers.com/
- Updated
- 2026-10-05 08:14
The expensive part of a literature review is not the reading. It is deciding which papers deserve to be read. A keyword list misses things, and a reference list only walks backwards in time. Connected Papers takes the opposite route: hand it a single paper and it hands back a graph of the field around it.
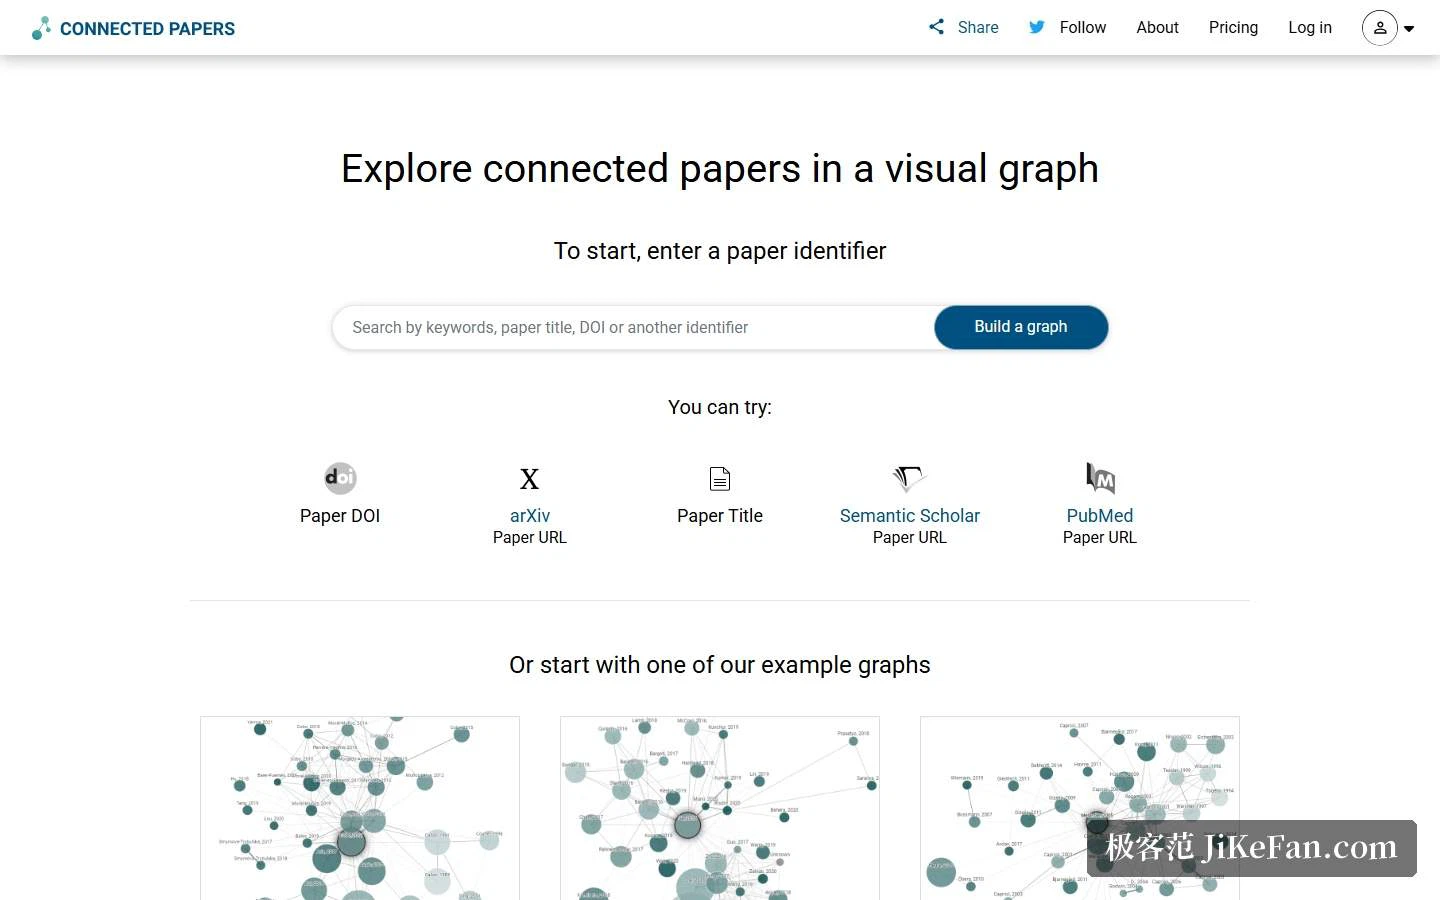
Five ways in, one graph out
The box on the front page accepts five kinds of identifier: a paper DOI, an arXiv link, a paper title, a Semantic Scholar link, or a PubMed link. Pick any one of them and a graph starts building. Three sample graphs sit below the box, so if you have not chosen a seed paper yet you can open someone else's field and look around before spending a build on your own.
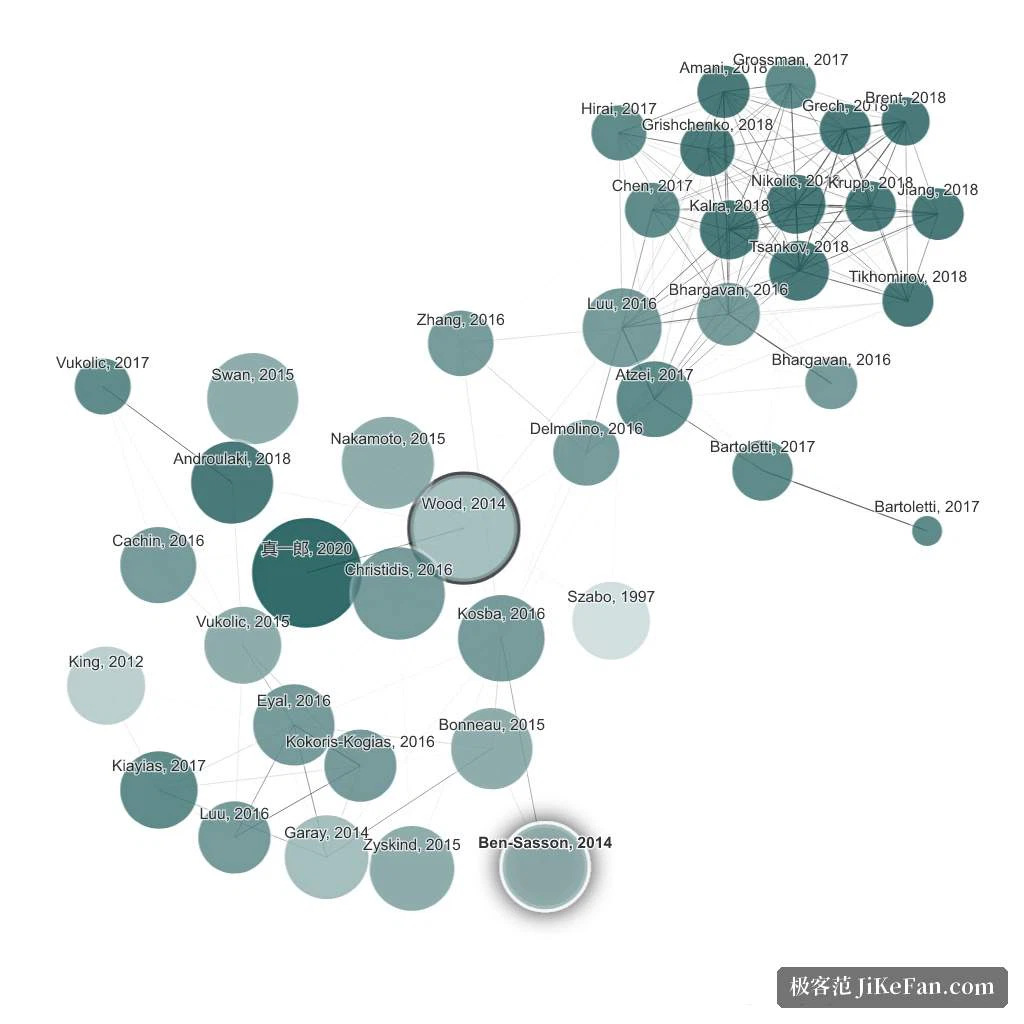
What comes back is not a search dump. Each graph is built by analysing roughly 50000 papers and keeping the several dozen most tightly connected to the seed, which means the nodes you see are a screened shortlist rather than the first page of results. That single design choice explains most of the tool's behaviour, good and bad.
Read position, not connection lines
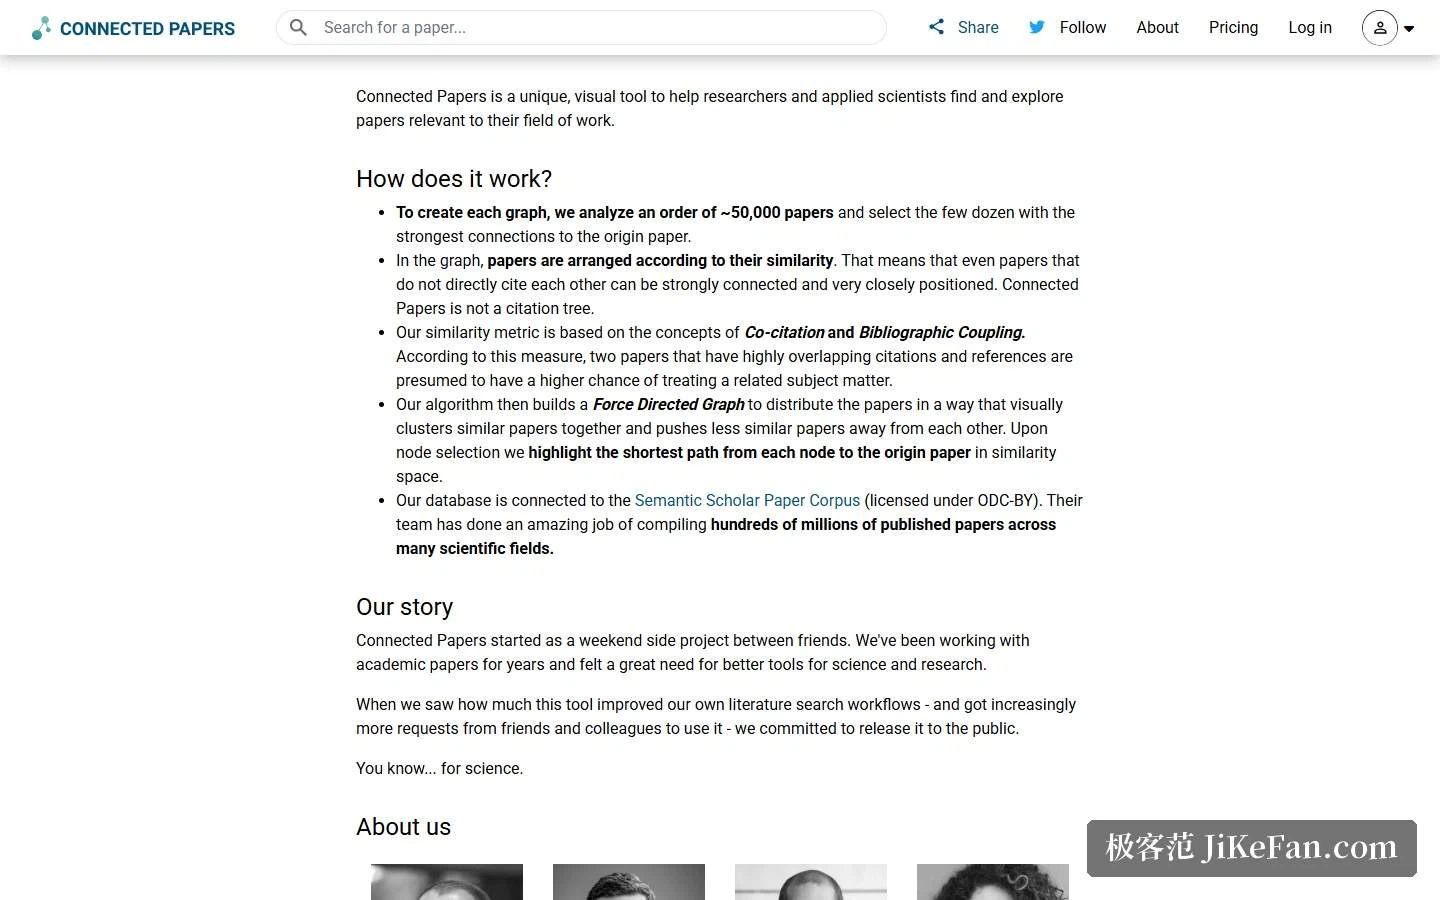
Here is where the product departs most sharply from intuition. Papers are placed by similarity, so two papers that never cite each other can end up shoulder to shoulder. Similarity is computed from co-citation and bibliographic coupling: papers whose reference lists and citing papers overlap heavily are treated as likely to be working on adjacent problems.
The site says plainly that the arrangement is driven by similarity rather than by citation, and it uses a force-directed layout that pulls similar papers together and pushes dissimilar ones apart. Select any node and the route from that node back to the seed paper is highlighted through similarity space. A line between two nodes is therefore not a citation, and reading it as one is the fastest way to misread the map.
Prior works and derivative works: the two ends of a review
A review has to look in two directions at once. Backwards, to see where a line of work came from. Forwards, to see where the field is heading. Two views serve those directions: Prior Works gathers the important earlier literature of a field, and Derivative Works gathers reviews of that field along with new work published after the seed paper.
Multi-origin graphs, a saved collection of papers and a history of the graphs you have built are listed in the official entitlements as available on every tier, the free one included. The substrate is the Semantic Scholar corpus under an ODC-BY licence, covering hundreds of scientific fields and hundreds of millions of papers; machine learning, biology and philosophy are among the fields the site names explicitly.
Pricing: five graphs a month on free, features intact
Three tiers. Free costs 0 a month and builds 5 graphs a month, and the entitlements table marks it as including all features. Academic costs 3 a month, or 36 billed annually, aimed at academic, non-profit and personal use, and unlocks unlimited graphs. Business costs 10 a month, or 120 billed annually, aimed at commercial and industry users, and is likewise unlimited.
Payment is stated to cover credit and debit cards, PayPal, Alipay and bank transfer. Subscriptions renew automatically and can be cancelled at any time. The page also flips between Individuals and Groups, and between yearly and quarterly billing cycles.
Put plainly, the line between free and paid sits at how many graphs you may build, not at what you may do with them. Reading the graph, both directional views and the saved collection behave the same on every tier, which is an unusually clean split for a research tool.

Who it suits
Three cases line up fairly cleanly. A graduate student opening a thesis topic needs to grasp the shape of an unfamiliar field quickly, and can start from one of the sample graphs before rebuilding around their own seed. A review author afraid of missing a key paper can take both directions, Prior Works and Derivative Works, and patch the gaps from each side. A dissertation author assembling a systematic reference list can start from the works they know they must cite and let the graph point at what is missing.
The product came out of the developers' own research workflow. The site says it began as a weekend side project and was opened to the public only because it genuinely improved how they searched, which is why the shape of the thing still follows a researcher's path instead of a marketing plan. That origin shows in the absence of a chat box, a writing assistant or a dashboard.
Where the map stops being useful
Being honest about the limits matters more than praising the picture. A graph built from similarity answers the question what else is about this, not the question what is true. Two papers sitting close together share subject matter and nothing more; citation direction, chronology, and whether a result has since been superseded all have to be checked in the papers themselves.
The screened shortlist also implies a deliberate omission. Because only the several dozen closest papers survive, a highly relevant paper that happens to sit slightly off your chosen seed can drop out of the picture entirely. The fix is procedural rather than technical: build a second graph from a different seed, or from a multi-origin pair, and compare.
The five graphs a month on the free tier turn out to be a useful constraint rather than a stingy one, because it makes you choose seeds deliberately. Anyone who has wasted an afternoon on a badly chosen starting point will recognise the discipline it imposes.
When finding literature turns from reading lists into reading a map, the first step of a review stops being guessing keywords and becomes laying out the structure of a field at a glance.